- Navigate to WordPress Admin Dashboard → Gravity Booking → Dashboard.
- Now you’re on the Reports page.
- We can see a Dashboard is present at the top of the page in which the Administrator can see the Total Customers, Total Services, Total Staff, and Total Amount Collection tabs.
- Also, four different graphs are present, which visualize the data according to the website.
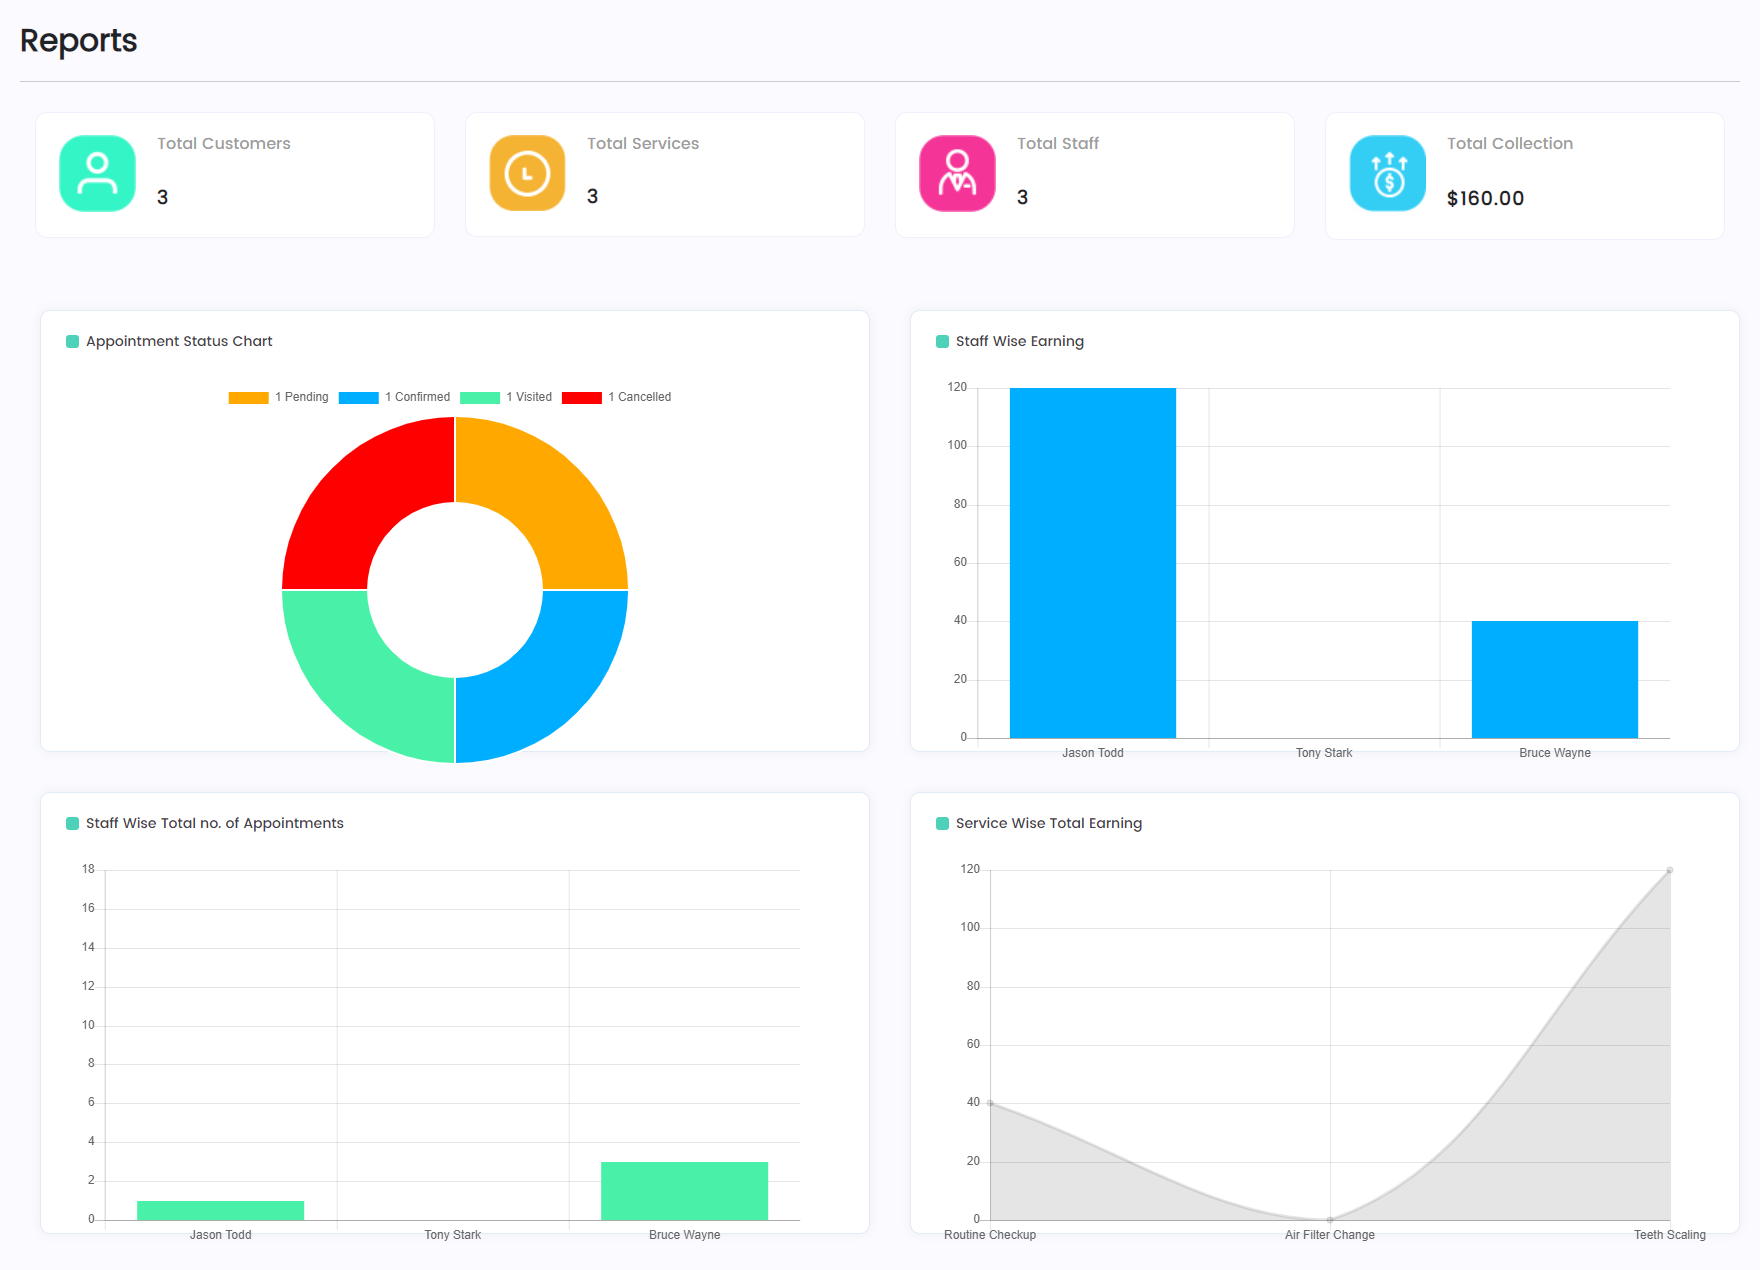
Appointment Status Chart
- In the Appointment Status Chart, we can see that all the appointments are displayed in a chart form indicating the total no. of appointments according to the status.
- We can hover over the chart, and it will display the total no. of appointments accordingly to which area we are hovering.
- The Administrator can also filter out the chart by clicking on the Status Bar available above the chart. This will exclude the appointments in the chart.
- For Example: If we click on the Cancelled and the Visited status bar in the chart, then all the appointments whose status was Cancelled and Visited will disappear from the chart.
- Click on the Cancelled and Visited Status Bar again, and it will appear on the chart again.
Staff Wise Earning
- In the Staff Wise Earning, we can see all the Staff and their earnings in graphical form.
- We can hover over the graphs of each staff, and it will display the total earning of each individual staff.
Staff Wise Total no. of Appointments
- In the Staff Wise Total no. of Appointments, we can see all the Staff and their appointments in graphical form.
- We can hover over the graphs of each staff, and it will display the total no. of appointments of each individual staff.
Service Wise Total Earning
- In the Service Wise Total Earning, we can see all the Services and their earnings in graphical form.
- We can hover over the graphs of each service, and it will display the total earnings of each individual service.